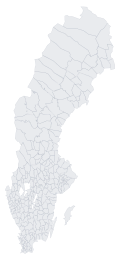
Sigtuna
- Share 2025
- 52.5 %
- Δ 2015→2025
- +12.9 pp
- Immigration page
- Immigration in Sigtuna
In depth · Uppsala
Uppsala ranks 37 of 290 municipalities for Share of residents with a foreign background (2025).
Source: SCB BE0101Q2 · 2025
Uppsala ranks 1 of 8 in Uppsala län for Share of residents with a foreign background (2025).
Source: SCB BE0101Q2 · 2025
Latest statistics: 2024–2025 depending on indicator
Uppsala: 75,522 residents (30.2%) had a foreign background in 2025, out of 249,726 residents. Source: Statistics Sweden. Sweden, foreign background: 27.7%; difference +2.5 percentage points (2025). 58,138 residents were born abroad (23.3%, 2025).
Foreign background means born abroad or born in Sweden to two foreign-born parents. These are population stocks, not annual immigration flows.
Last updated: View changelog
Source: Statistics Sweden (SCB), BE0101Q2 — observed population composition (stock). People received further down are a flow and measure something else. Stock vs flow
Share of the population in Uppsala with a foreign background. Source: Statistics Sweden (SCB), BE0101Q2. The 2025 observation uses the CKM disclosure-control method.
Residents by region of birth, 2024. This block uses 2024 data and may differ in year from the introduction above. Foreign-born are persons born outside Sweden. Source: Statistics Sweden (SCB), FolkmRegFlandK.
Received 2020–2024 (a flow), the Police's vulnerable areas and a own illustrative scenario.
Analysis/model Own illustrative scenario: mean annual reception 2020–2024 × Ruist’s national refugee life-cycle estimate using 2015 public finances, divided by 2024 population; no price adjustment. Assumes the national estimate applies locally. Not an observed municipal cost; not everyone with a foreign background. Formula, assumptions and limitations
Uppsala is preselected. Add up to 5 other municipalities — or use the shortcuts for the top/bottom 5.
Max 6 municipalities. Source: SCB BE0101Q2 (UtlSvBakgGrov). · Uppsala
Nearest municipalities (distance between municipal centre points) and municipalities in the same county with a similar share, plus county and national averages. Not all share a border with the municipality.
| Municipality | Share 2025 | Δ 2015→2025 | Immigration page |
|---|---|---|---|
| Sigtuna | 52.5 % | +12.9 pp | Immigration in Sigtuna |
| Uppsala | 30.2 % | +6.8 pp | |
| Sweden | 27.7 % | +5.5 pp | |
| Uppsala län | 26.3 % | +6.5 pp | |
| Håbo | 24.2 % | +6.1 pp | Immigration in Håbo |
| Enköping | 23.4 % | +7.0 pp | Immigration in Enköping |
| Knivsta | 23.0 % | +9.0 pp | Immigration in Knivsta |
| Heby | 16.9 % | +4.4 pp | Immigration in Heby |
Foreign background, all ages/sexes. County and national shares: own ratios of SCB published geographic counts; change 2015–2025 in percentage points. CKM method break 2025; subgroup cells may not sum to the published total. SCB
| Party | Share | vs 2022 | Votes | Seats |
|---|---|---|---|---|
| 26.15 % | – | 43,342 | 21 | |
| 18.98 % | – | 31,457 | 16 | |
| 13.25 % | – | 21,958 | 11 | |
| 9.40 % | – | 15,576 | 8 | |
| 9.21 % | – | 15,266 | 8 | |
| 7.99 % | – | 13,238 | 7 | |
| 6.67 % | – | 11,060 | 5 | |
| 3.43 % | – | 5,680 | 3 | |
| 2.47 % | – | 4,093 | 2 | |
| Other parties (29) | 2.46 % | – | 4,082 | – |
Latest actual election: 13 September 2026 (final count). Turnout figures in Kolada series elsewhere on this page refer to an earlier election and are labelled with their series year.
Full municipal election result →Results by voting district →
Schools, crime, economy, tax rate and elections are on the municipality's main page.
Open Uppsala municipality in figures →In 2025, 30.2 % of the population in Uppsala had a foreign background according to Statistics Sweden (BE0101Q2) — 2.5 percentage points above the national average (27.7 %). "Foreign background" is the broader Statistics Sweden definition and includes both people born abroad and people born in Sweden to two foreign-born parents. The share is a stock measure and does not show annual immigration (inflow).
75,522 residents of Uppsala had a foreign background (2025). Source: Statistics Sweden, UtlSvBakgGrovCKM, published count. CKM-protected component cells need not sum exactly to the published total.
The share has risen from 17.5 % (2002) to 30.2 % (2025), a change of +12.8 percentage points. Source: Statistics Sweden (SCB), BE0101Q2.
Born abroad = a person born outside Sweden. Foreign background = born abroad, or born in Sweden to two foreign-born parents. Both measures are official; foreign background is at least as large for the same population and year.
See the "Country/region of birth" section on this page. Foreign-born residents are people born outside Sweden, reported in three aggregated groups: the Nordic countries excluding Sweden, the rest of Europe, and outside Europe. Source: Statistics Sweden (SCB), FolkmRegFlandK.
BE0101Q2Foreign/Swedish background — share by municipality (UtlSvBakgGrov)Reference period: 2002–2025 · Retrieved: 2026-10-11
Open source ↗FodelselandArKCKM / FolkmRegFlandKCKM; history FodelselandArKPopulation by region, region/country of birth and sexReference period: 2000–2025 · Retrieved: 2026-10-11
Open source ↗BE0101N1Population by municipality, age, sex and year (31 Dec)Reference period: 2002–2025 · Retrieved: 2026-08-13
Open source ↗ME0104General elections — votes per party and municipality (Election Authority via SCB)Each figure on this page is traceable to the dataset listed above. Missing data is left out — never shown as zero. Definitions, model and sources