The data clash
Utopia vs Reality
How to read this
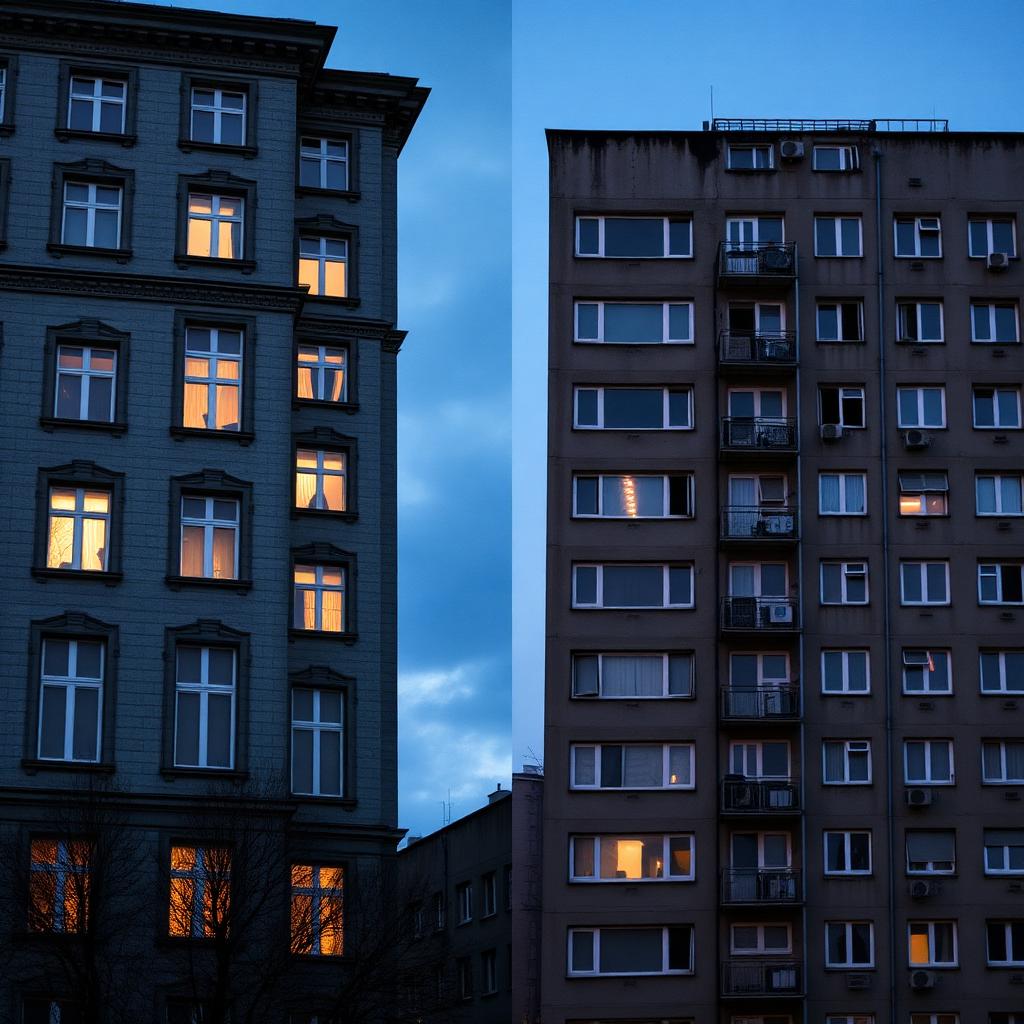
“The data clash” is the gap between the utopia — the image of Sweden as one of the world's best, safest and most equal countries — and the reality in the statistics. The charts below show what the numbers actually say, not what we wish they said.
Utsatta områden: index 290 vs riket 470 (Mäklarstatistik)
199520102024
Human consequence
Persona
A homeowner in an area classified as vulnerable.
Then
- The house sold at market price after 3–6 weeks on the market.
- Insurance gave a discount for established suburbs.
- Mortgage rates were discussed — not the area's future.
Now
- Listing sits 6+ months. Sale price 25–40 % below the national average for comparable homes.
- Insurance adds a premium for housing fires and burglary.
- Buyers ask specifically about CCTV and the latest shooting.
The Nordics — same metric
Method & uncertainty
Definitions
- — ”Utsatt område” följer Polismyndighetens lista. Prisdata från Svensk Mäklarstatistik / Booli.
Uncertainties
- — Områdesindelningen ändras med Polisens listor — index är beräknat för konstanta postnummer 1995–2024.
2035
What happens to municipal tax revenue when entire housing stocks lose 30 % of their value?
On the 2015–2024 trend the gap widens from 180 to ≈ 250 index points by 2035.
Read the full investigation of how Sweden has changed.
Back to overview →