Skip to content
SVERIGEFAKTA

Enköping Municipality – facts and statistics

In Enköping municipality, 48,804 people live (2025).

Uppsala County · municipal tax 33.05 % · population +29.6 % since 2002

Open Enköping on the mapCreate reportCompare Enköping with another municipality

Coming soon

Email us at kontakt@sverigefakta.com

Last updated: View changelog

Direct answers

Verified municipal figures with reference year, definition and source. Missing data is left out — never shown as zero.

How many people live in Enköping?

48,804 residents

Population · 2025 · municipality

Change since 2011: +8,789 residents

14-yr trend: +22 %

Population registered as resident in the municipality on 31 December of the stated year.

Source: SCB BefolkningCKM (000007ME) · scb:BE0101N1 · observed value from the source

More about Population

How old is the population of Enköping?

41.4 years

Median age · 2025 · municipality

Median age approximated linearly within the five-year age band where half the population is reached (Statistics Sweden five-year bands, 31 December).

Source: SCB BE0101N1 · scb:BE0101N1 · own calculation from source data

More about Median age

Foreign background in Enköping (key figure)

23.4 %

Foreign background · 2025 · municipality

Change since 2011: +9.4 pp

Sweden: 27.7 % (−4.3 pp)

14-yr trend: +9.4 pp

Born abroad, or born in Sweden to two foreign-born parents, as a share of the population (Statistics Sweden UtlSvBakgGrov, 31 December).

Source: SCB BE0101Q2 · scb:BE0101Q2 · observed value from the source

More about Foreign background

How high is the municipal tax in Enköping?

33.05 %

Total municipal tax rate · 2026 · municipality

Municipal average (unweighted): 33.30 % (−0.25 pp)

Sum of the municipal and regional tax rate in 2026 (municipal 21.34 % + regional 11.71 %). Burial fee and religious community fees are not included.

Source: SCB OE0101 Kommunalskatter2000 · observed value from the source

What does the labour market look like in Enköping?

2.8 %

Openly unemployed 18–65, share of population (%) · 2025 · municipality

Change since 2014: +0.2 pp

Municipal average (unweighted): 2.7 % (+0.1 pp)

County average (unweighted): 2.6 %

11-yr trend: +0.2 pp

Openly unemployed 18–65, share of population (%)

Source: Arbetsförmedlingen via Kolada N03937 · Kolada:N03937 · observed value from the source

More about Openly unemployed 18–65, share of population (%)

What is the income level in Enköping?

355,900 SEK

Median income, 20+ · 2024 · municipality

Change since 2013: +99,600 SEK

Municipal average (unweighted): 345,416 SEK (+10,484 SEK)

County average (unweighted): 355,875 SEK

11-yr trend: +39 %

Median income, 20+

Source: SCB HE0110 · SCB:HE0110 · observed value from the source

More about Median income, 20+

How much violence in public places is reported in Enköping?

175

Violence in public places against adults, reported offences per 100,000 residents · 2025 · municipality

Shared rank 110 of 290 ranked municipalities (2025) — highest number of reported offences per 100,000 residents. An order of reported offences, not of victimisation, safety or risk.

Change since 2017: −42

Sweden: 216 (−41)

8-yr trend: -19 %

Reported offences of assault, including aggravated assault, committed outdoors in public places against people aged 18 or over (3 kap. 5, 6 § BrB Misshandel inkl. grov). Reported offences are not the same as committed or cleared offences; reporting propensity, police operations and local movement patterns affect the level.

Source: Brå — Enköping.xlsx · Bra:vald-offentlig-miljo-kommun · observed value from the source

More about Violence in public places against adults, reported offences per 100,000 residents
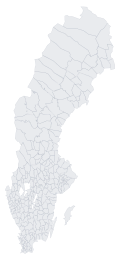
Location of the municipality in Sweden

Key figures

Population (31 Dec)· 2025

48,804people
14-yr trend: +22 %

SCB BefolkningCKM (000007ME)

Municipal tax rate (%)· 2025

21.3%
+0.6 pp higher than Sweden (source's national figure, 2025)
Sweden (source's national figure, 2025): 20.7 % · County average (unweighted): 21.6 %
11-yr trend: +0.5 pp ↑
209/289

SCB via Kolada N00901

Median income, 20+· 2024

355,900SEK
+10,484 SEK higher than municipal average (unweighted)
Municipal average (unweighted): 345,416 SEK · County average (unweighted): 355,875 SEK
11-yr trend: +39 %

SCB HE0110

Openly unemployed 18–65, share of population (%)· 2025

2.8%
-0.4 pp lower than Sweden (source's national figure, 2025)
Sweden (source's national figure, 2025): 3.1 % · County average (unweighted): 2.6 %
11-yr trend: +0.2 pp ↑
104/290

Arbetsförmedlingen via Kolada N03937

Year 9 pupils eligible for vocational upper secondary programmes, municipality of location (%)· 2025

83.1%
-1.0 pp lower than Sweden (source's national figure, 2025)
Sweden (source's national figure, 2025): 84.1 % · County average (unweighted): 81.0 %
11-yr trend: -3.8 pp
tied 114/282

Skolverket via Kolada N15424

Overcrowding in apartment blocks (norm 2), share (%)· 2025

20.3%
+5.2 pp higher than Sweden (source's national figure, 2025)
Sweden (source's national figure, 2025): 15.1 % · County average (unweighted): 16.8 %
11-yr trend: +5.0 pp ↑
26/290

SCB via Kolada N07907

Life expectancy, women· 2025

85.5years
+0.4 years higher than Sweden (source's national figure, 2025)
Sweden (source's national figure, 2025): 85.1 years · County average (unweighted): 85.1 years
11-yr trend: +2 %
tied 67/290

SCB via Kolada N00925

Reported violent offences (per 100,000)· 2025

1,020.6/100k
-46.2 /100k lower than Sweden (source's national figure, 2025)
Sweden (source's national figure, 2025): 1,066.8 /100k · County average (unweighted): 886.5 /100k
11-yr trend: +32 % ↑
91/290

Brå via Kolada N07403

Governing coalition: M, S, L (majority)

What differs

Neutral differences from the source’s official figure for Sweden in the same period. Selection threshold: at least 2 percentage points, or 5% for other units.

Overcrowding in apartment blocks (norm 2), share (%)

Enköping20.3 %
Sweden15.1 %

Enköping is above Sweden by 5.2 percentage points.

2025 · SCB via Kolada N07907 · rank 26 of 290

Compare with nearby municipalities

Comparable values from the same period and definition. Sweden is the source’s official national figure.

IndicatorEnköpingHåboUpplands-BroSträngnäsKnivstaSweden
Openly unemployed 18–65, share of population (%)2025 · Arbetsförmedlingen via Kolada N039372.8 %2.4 %4.4 %2.7 %2.3 %3.1 %
Municipal tax rate (%)2025 · SCB via Kolada N0090121.3 %21.6 %19.4 %21.7 %20.9 %20.7 %
Year 9 pupils eligible for vocational upper secondary programmes, municipality of location (%)2025 · Skolverket via Kolada N1542483.1 %82.9 %84.0 %83.5 %85.6 %84.1 %
Overcrowding in apartment blocks (norm 2), share (%)2025 · SCB via Kolada N0790720.3 %13.2 %22.6 %11.1 %16.3 %15.1 %
Open the full comparison tool

Municipalities with a similar profile

Most similar to Enköping on share aged 0–19, share aged 65–79, share aged 80+, population, inhabitants per km² (2025), in order. An exploration aid — not a ranking of quality or a recommendation.

  1. 1. Nässjö

    Closest on: Share aged 0–19, Inhabitants per km²

    Share aged 0–19
    23.9 %
    Share aged 65–79
    15.7 %
    Share aged 80+
    6.9 %
    Population
    31,474
    Inhabitants per km²
    34
  2. 2. Borlänge

    Closest on: Population, Share aged 80+

    Share aged 0–19
    23.0 %
    Share aged 65–79
    15.1 %
    Share aged 80+
    6.6 %
    Population
    51,354
    Inhabitants per km²
    88
  3. 3. Mjölby

    Closest on: Share aged 65–79, Share aged 0–19

    Share aged 0–19
    23.7 %
    Share aged 65–79
    15.0 %
    Share aged 80+
    7.0 %
    Population
    28,823
    Inhabitants per km²
    52
  4. 4. Uddevalla

    Closest on: Population, Share aged 0–19

    Share aged 0–19
    23.3 %
    Share aged 65–79
    15.7 %
    Share aged 80+
    7.0 %
    Population
    56,744
    Inhabitants per km²
    89
  5. 5. Strängnäs

    Closest on: Inhabitants per km², Share aged 0–19

    Share aged 0–19
    23.4 %
    Share aged 65–79
    16.5 %
    Share aged 80+
    7.1 %
    Population
    39,387
    Inhabitants per km²
    53
Method

Measures: share aged 0–19, 65–79 and 80+ (Kolada), population on 31 December (Statistics Sweden BE0101N1) and inhabitants per km² (own calculation: population ÷ land area from Kolada, same year). Share aged 20–64 is omitted because the four age shares sum to 100. Population and density are compared on a logarithmic scale because they span several orders of magnitude.

Each measure is standardised (z-score across all municipalities with every measure used); the distance is the Euclidean distance with equal weight per measure. Equal distances are ordered by municipality code. A measure is only used if at least 90% of municipalities have it for the same year; if this municipality lacks a measure, that measure is left out rather than showing an empty list. Missing values are never treated as zero. No similarity percentage is shown.

Municipal accounts

How Enköping uses municipal funds

View all accounts data →

Actual net cost per inhabitant in 2025, from Statistics Sweden's Municipal Accounts via Kolada. This is a verified selection, not a complete budget, and the values must not be added as total expenditure.

Actual outcome 2025

Compulsory school, preschool class–year 9
14,648 SEK/inh.
Elderly care
14,287 SEK/inh.
Preschool, school-age childcare and other educational activities
9,985 SEK/inh.
Disability services
9,564 SEK/inh.
Individual and family care
5,484 SEK/inh.
Upper-secondary school
5,115 SEK/inh.
Infrastructure, protection and related activities
4,384 SEK/inh.
Leisure activities
2,600 SEK/inh.
Cultural activities
1,063 SEK/inh.
Political activities
768 SEK/inh.

Budget (plan)

No verified budget for Enköping is shown. Municipal budgets are adopted by each council and published as documents; there is no common machine-readable official source for all 290 municipalities, so we do not copy figures that cannot be checked automatically. The budget is never mixed with the actual outcome above.

Supplier invoices over SEK 100,000

Loading invoices…

What has changed in Enköping?

Latest observed period compared with the preceding period in the same series. A change between two periods — not a revision or a change of definition.

  • Population (31 Dec)2024: 48,591 people → 2025: 48,804 people
  • Municipal tax rate (%)2024: 21.3 % → 2025: 21.3 %(unchanged)
  • Median income, 20+2023: 342,600 SEK → 2024: 355,900 SEK
  • Openly unemployed 18–65, share of population (%)2024: 2.6 % → 2025: 2.8 %
All verified updates

Current events in Enköping →

How many people live in Enköping?

Enköping had 48,804 residents on 31 December 2025 (Statistics Sweden, BE0101N1). Since 2002 the population has grown by 11,157 people. The largest urban area Enköping had 26,353 residents (2023, SCB MI0810).

Population· 2025

48,804
14-yr trend: +22 %

SCB BE0101N1

Population change since 2002· 2002–2025

+29.6%

SCB BE0101N1

Immigration and foreign background in Enköping — full breakdown →

How has Enköping changed?

Observed annual values from SCB. Gaps are not filled in and a single observation is not shown as a trend.

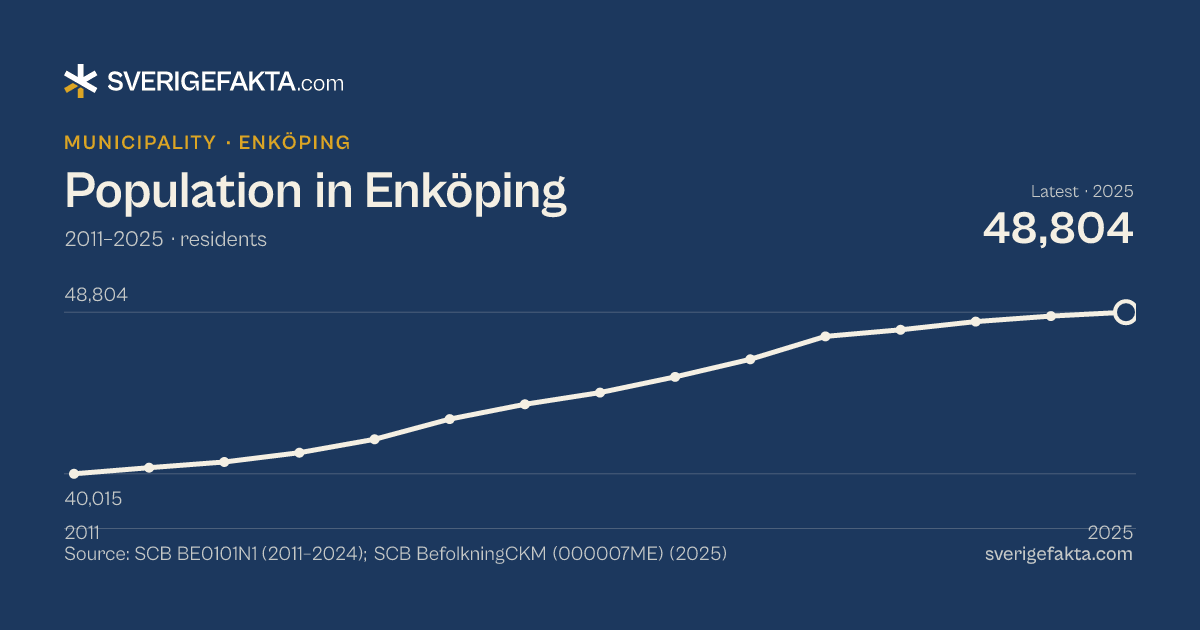
Population in Enköping

2011–2025 · residents

48,804residents (2025)

14-yr trend: +22 %
Larger chart and table
Line chart of population in Enköping 2011–2025, from 40,015 residents to 48,804 residents. Source: SCB BE0101N1 (2011–2024); SCB BefolkningCKM (000007ME) (2025).
Registered residents on 31 December each year. Source: SCB BE0101N1. Primary data, shown unchanged.
Population in Enköping, 2011–2025
Yearresidents
202548,804
202448,591
202348,292
202247,848
202147,489
202046,240
201945,287
201844,429
201743,797
201642,988
201541,893
201441,163
201340,656
201240,349
201140,015
Open chart page

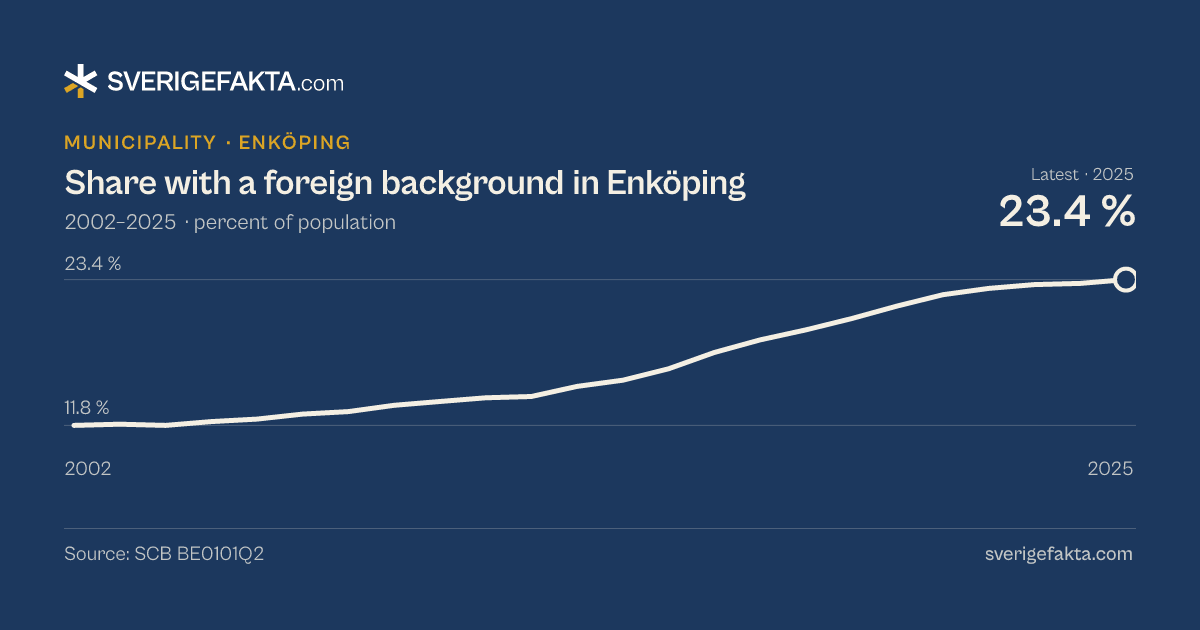
Share with a foreign background in Enköping

2002–2025 · percent of population

23.4% (2025)

23-yr trend: +11.6 pp
Larger chart and table
Line chart of share with a foreign background in Enköping 2002–2025, from 11.8 % to 23.4 %. Source: SCB BE0101Q2.
Foreign-born, or born in Sweden to two foreign-born parents, as a share of the population on 31 December. The 2025 observation uses Statistics Sweden's CKM disclosure-control method. Source: SCB BE0101Q2. Primary data, shown unchanged.
Share with a foreign background in Enköping, 2002–2025
Year%
202523.4
202423.1
202323.0
202222.7
202122.2
202021.3
201920.3
201819.4
201718.6
201617.6
201516.3
201415.4
201314.9
201214.1
201114.0
201013.7
200913.4
200812.9
200712.7
200612.3
200512.1
200411.8
200311.9
200211.8
Open chart page

Compare Enköping with another municipality →

Age and sex structure in Enköping

Actual municipal figures from SCB — not a scaled national profile.

Children 0–14
8,737
17.9 %
Working age 15–64
29,704
60.9 %
Aged 65+
10,371
21.2 %
Aged 80+
3,183
6.5 %
Women
24,087
49.3 %

Population pyramid

Enköping, 2025 · five-year age groups

Men 24,725Women 24,087Median age 41.4 yrs

Number of people per five-year age group, 31 December.

Show the data as a table
Population by age and sex in Enköping, 2025
AgeMenWomen
0-41,2691,201
5-91,6481,525
10-141,6051,489
15-191,4911,465
20-241,4091,190
25-291,3211,146
30-341,6901,554
35-391,8051,786
40-441,4751,435
45-491,3941,337
50-541,5441,508
55-591,6151,552
60-641,4931,494
65-691,3131,263
70-741,1201,138
75-791,1141,240
80-84863921
85-89377513
90-94148245
95-992874
100+311

Source: SCB BE0101N1 (BefolkningCKM) · 2025. 0–14: 8,737, 15–64: 29,704, 65+: 10,371.

Foreign background by age and sex is not published at municipal level by Statistics Sweden. Foreign background for this municipality is shown by area (DeSO) further down the page.

Households in Enköping

Register-based household statistics from Statistics Sweden. Shares are derived from compatible published cells within the same SCB table and reference year.

Households
22,145
Persons per household
2.20
One-person households
38.7 %
8,573
Households with children 0–24
29.9 %
6,628

2025 · SCB HushallT09, HushallT03CKM, HushallT05CKM

SCB applies CKM disclosure control to the 2025 figures; published values contain a small amount of controlled random uncertainty.

Municipal election 2026

Final · Source: Valmyndigheten
Turnout
82.47 %
Seats
61
Valid votes
30,935
Blank votes
506
Result per party, municipal council election 2026
PartySharevs 2022Seats
25.61 %–16
21.66 %–13
17.88 %–11
8.88 %–5
6.50 %–4
6.40 %–4
6.33 %–4
3.61 %–2
2.47 %–2
Other parties (11)0.66 %––

Latest actual election: 13 September 2026 (final count). Turnout figures in Kolada series elsewhere on this page refer to an earlier election and are labelled with their series year.

Full municipal election result →Results by voting district →

How the municipality voted in the 2026 Riksdag election

Final · Source: Election Authority
Turnout
85.16 %(2022: 84.36 %)
Eligible voters
36,821
Valid votes
31,007
Invalid (of which blank)
351 (314)
Riksdag election 2026, result per party in Enköpings kommun
PartySharevs 2022
25.89 %−2.0
22.46 %−2.2
21.98 %+0.3
7.43 %+1.1
6.25 %+2.0
6.06 %−0.6
4.41 %+0.8
3.93 %+0.6
0.76 %–
Other parties (14)0.83 %–
Total valid votes100 %

Share of valid votes cast in the municipality. ± 2022 is the change in percentage points as reported by the Election Authority for the same party code; "–" means no comparable 2022 value. Votes are shown on wider screens. Source updated 2026-09-19 · retrieved 2026-10-01.

Openly unemployed 18–65, share of population (%)
Enköping 2.8 % · Municipal average (unweighted) 2.7 %

Use this statistic

Source: Arbetsförmedlingen via Kolada N03937 (Kolada:N03937) · 2014–2025 · Data status: complete / derived

  • Openly unemployed 18–65, share of population (%)
    2025 · Municipal average (unweighted) 2.7 % (+0.1 pp) · Uppsala County 2.6 %
    2.8%
  • Long-term unemployed, 25–65, share of population (%)
    2025 · Municipal average (unweighted) 3.2 % (+0.5 pp) · Uppsala County 3.1 %
    3.7%
  • Residents aged 16–24 not in employment, education or training (%)
    2024 · Municipal average (unweighted) 6.9 % (+0.6 pp) · Uppsala County 6.8 %
    7.5%

Indicators for work in Enköping.

Economy & tax

All indicators →
Municipal tax rate (%)
Enköping 21.3 % · Municipal average (unweighted) 21.7 %

Use this statistic

Source: SCB via Kolada N00901 (Kolada:N00901) · 2014–2025 · Data status: complete / derived

  • Municipal tax rate (%)
    2025 · Municipal average (unweighted) 21.7 % (−0.4 pp) · Uppsala County 21.6 %
    21.3%
  • Tax base per resident (SEK)
    2025 · Municipal average (unweighted) 280,284 SEK (+4,607 SEK) · Uppsala County 286,215 SEK
    284,891SEK
  • Equity ratio, municipality (%)
    2025 · Municipal average (unweighted) 40.5 % (−9.3 pp) · Uppsala County 32.6 %
    31.2%

Indicators for economy & tax in Enköping.

Year 9 pupils eligible for vocational upper secondary programmes, municipality of location (%)
Enköping 83.1 % · Municipal average (unweighted) 81.5 %

Use this statistic

Source: Skolverket via Kolada N15424 (Kolada:N15424) · 2014–2025 · Data status: complete / derived

  • Year 9 pupils eligible for vocational upper secondary programmes, municipality of location (%)
    2025 · Municipal average (unweighted) 81.5 % (+1.6 pp) · Uppsala County 81.0 %
    83.1%
  • Year 9 average merit rating, home municipality (17 subjects)
    2025 · Municipal average (unweighted) 218.3 points (+1.7 points) · Uppsala County 217.8 points
    220.0points
  • Upper-secondary students graduating within 3 years, home municipality (%)
    2025 · Municipal average (unweighted) 69.3 % (−1.0 pp) · Uppsala County 70.0 %
    68.2%

Indicators for schools in Enköping.

Overcrowding in apartment blocks (norm 2), share (%)
Enköping 20.3 % · Municipal average (unweighted) 13.5 %

Use this statistic

Source: SCB via Kolada N07907 (Kolada:N07907) · 2014–2025 · Data status: complete / derived

  • Overcrowding in apartment blocks (norm 2), share (%)
    2025 · Municipal average (unweighted) 13.5 % (+6.8 pp) · Uppsala County 16.8 %
    20.3%
  • House prices, detached houses, SEK/m²
    2025 · Municipal average (unweighted) 21,704 SEK/m² (+7,475 SEK/m²) · Uppsala County 25,972 SEK/m²
    29,179SEK/m²
  • Rental dwellings, number per 1,000 residents
    2025 · Municipal average (unweighted) 171.6 per 1,000 residents (−1.2 per 1,000 residents) · Uppsala County 152.2 per 1,000 residents
    170.4per 1,000 residents

Indicators for housing in Enköping.

Life expectancy, women
Enköping 85.5 years · Municipal average (unweighted) 84.7 years

Use this statistic

Source: SCB via Kolada N00925 (Kolada:N00925) · 2014–2025 · Data status: complete / derived

  • Life expectancy, women
    2025 · Municipal average (unweighted) 84.7 years (+0.8 years) · Uppsala County 85.1 years
    85.5years
  • Life expectancy, men
    2025 · Municipal average (unweighted) 81.3 years (+0.5 years) · Uppsala County 81.9 years
    81.8years
  • Ill-health rate, days per insured person
    2025 · Municipal average (unweighted) 26.3 days (−4.7 days) · Uppsala County 23.3 days
    21.6days

Indicators for health in Enköping.

Reported offences, total (per 100,000)
Enköping 11,719 /100k · Municipal average (unweighted) 9,857 /100k

Use this statistic

Source: Brå via Kolada N07540 (Kolada:N07540) · 2014–2025 · Data status: complete / derived

  • Reported offences, total (per 100,000)
    2025 · Municipal average (unweighted) 9,857 /100k (+1,862 /100k) · Uppsala County 10,349 /100k
    11,719/100k
  • Reported violent offences (per 100,000)
    2025 · Municipal average (unweighted) 885.9 /100k (+134.7 /100k) · Uppsala County 886.5 /100k
    1,020.6/100k
  • Reported offences against liberty and peace (per 100,000)
    2025 · Municipal average (unweighted) 1,418.9 /100k (−98.5 /100k) · Uppsala County 1,302.7 /100k
    1,320.4/100k

Indicators for crime in Enköping.

Assignments per elected municipal politician
Enköping 1.6 assignments/politician · Municipal average (unweighted) 1.8 assignments/politician

Use this statistic

Source: Valmyndigheten via Kolada N05813 (Kolada:N05813) · 2014–2025 · Data status: complete / derived

  • Assignments per elected municipal politician
    2025 · Municipal average (unweighted) 1.8 assignments/politician (−0.2 assignments/politician) · Uppsala County 1.7 assignments/politician
    1.6assignments/politician
  • Residents per elected municipal politician
    2025 · Municipal average (unweighted) 221.4 residents/politician (+116.0 residents/politician) · Uppsala County 286.5 residents/politician
    337.4residents/politician
  • Elected municipal politicians part-time, share (%)
    2025 · Municipal average (unweighted) 2.5 % (+1.6 pp) · Uppsala County 2.5 %
    4.2%

Indicators for politics in Enköping.

Explore Enköping further

More about municipalities near Enköping

Geographically closest plus selected neighbours in the same county.

Frequently asked questions about Enköping

›How many people live in Enköping?

In 2025, Enköping Municipality had 48,804 residents according to Statistics Sweden (BefolkningCKM (000007ME)). Of these, 26,353 lived in the main urban area Enköping (2023).

›How has the population of Enköping changed?

Since 2002 the population has grown by 11,157 people (+29.6 %). Source: Statistics Sweden BE0101N1.

›Which county is Enköping in?

Enköping Municipality is located in Uppsala County (county code 03).

›What is the municipal tax rate in Enköping?

In 2026 the total local tax rate in Enköping is 33.05 % (municipality 21.34 % plus region 11.71 %). That is rank 98 of 290 municipalities from lowest to highest. Source: Statistics Sweden OE0101.

›How does Enköping use municipal funds?

Selected actual net costs in 2025 include Compulsory school, preschool class–year 9: 14,648 SEK per inhabitant; Elderly care: 14,287 SEK per inhabitant; Preschool, school-age childcare and other educational activities: 9,985 SEK per inhabitant. These are outcomes from Statistics Sweden's Municipal Accounts via Kolada, not a complete budget and not figures to add as total expenditure.

›What does unemployment look like in Enköping?

In Enköping, openly unemployed 18–65, share of population (%) was 2.8 % (2025). The national figure is 3.1 %. Source: Arbetsförmedlingen via Kolada N03937. Observation SF.KOLADATS-ARBETSLOSHET-18-65.0381.2025.

›How are school results in Enköping?

In Enköping, year 9 pupils eligible for vocational upper secondary programmes, municipality of location (%) was 83.1 % (2025). The national figure is 84.1 %. Source: Skolverket via Kolada N15424. Observation SF.KOLADATS-BEHORIGHET-GYMNASIUM.0381.2025.

›How much crime is reported in Enköping?

In Enköping, reported offences, total (per 100,000) was 11,719 /100k (2025). The national figure is 13,581 /100k. Source: Brå via Kolada N07540. Observation SF.KOLADATS-ANMALDA-BROTT-TOTALT.0381.2025.

›Where does the data come from?

Population comes from Statistics Sweden BE0101N1 and foreign background from BE0101Q2. Local key figures come from Kolada (RKA) and Statistics Sweden via SVERIGEFAKTA's municipal data engine, and every figure carries its own observation ID.

Sources and method

  • BE0101N1Population by municipality, age, sex and year (31 Dec)

    Reference period: 2002–2025 · Retrieved: 2026-08-13

    Open source ↗
  • BE0101Q2Foreign/Swedish background — share by municipality (UtlSvBakgGrov)

    Reference period: 2002–2025 · Retrieved: 2026-10-11

    Open source ↗
  • BE0101SHousehold statistics by municipality — households, size and household type
    Open source ↗
  • KoladaMunicipal key figures (RKA) — via SVERIGEFAKTA's municipal data engine
    Open source ↗

The figures on this page can be traced to their stated sources. Where an observation ID is available, it is shown with the corresponding fact. Read the method.

Foreign background: 23.4 % in 2025 (SCB BE0101Q2).

Use this statistic

Copy a reference or the canonical link. The original source is included when registered for this page.

Short source
SVERIGEFAKTA, “Enköping Municipality population 2025: 48,804 residents”. Original source: SCB, SCB, Kolada. https://sverigefakta.com/en/municipality/enkoping
Full reference
SVERIGEFAKTA, “Enköping Municipality population 2025: 48,804 residents”. Original source: SCB (https://api.scb.se/OV0104/v1/doris/sv/ssd/START/BE/BE0101); SCB (https://api.scb.se/OV0104/v1/doris/sv/ssd/BO/BO0101/BO0101C/LagenhetNyKv16); Kolada (https://api.kolada.se/v3/kpi). https://sverigefakta.com/en/municipality/enkoping
APA 7
Enköping Municipality population 2025: 48,804 residents. (n.d.). SVERIGEFAKTA. Retrieved 2026-10-28, from https://sverigefakta.com/en/municipality/enkoping Original source: SCB, SCB, Kolada.
Harvard
“Enköping Municipality population 2025: 48,804 residents” (n.d.) SVERIGEFAKTA. Available at: https://sverigefakta.com/en/municipality/enkoping (Accessed: 2026-10-28). Original source: SCB, SCB, Kolada.
BibTeX
@misc{sverigefakta_2026_en_municipality_enkoping,
  title        = {Enköping Municipality population 2025: 48,804 residents},
  howpublished = {\url{https://sverigefakta.com/en/municipality/enkoping}},
  note         = {Presented by SVERIGEFAKTA; original source SCB, SCB, Kolada}
}
Canonical link
https://sverigefakta.com/en/municipality/enkoping
More citation formats and rules